|
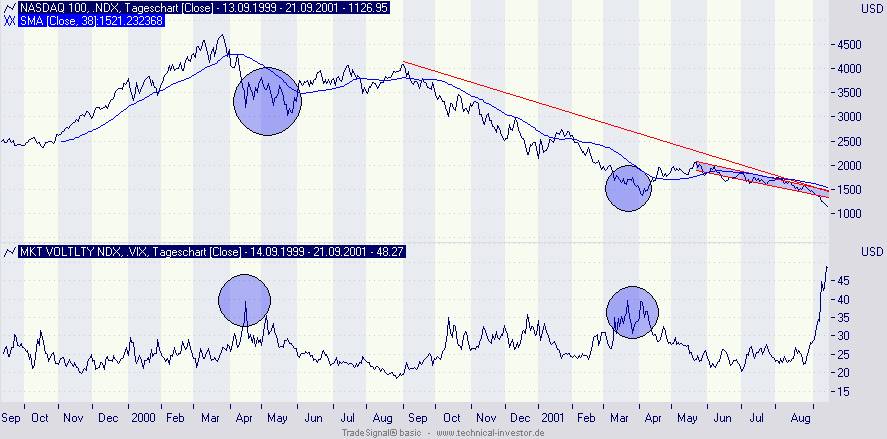
Die Volatilitaet ist in die Hoehe ge-schossen, so dass man bis 1987 zurueckblicken muss, um eine Ent-sprechung zu finden.
Eine hohe Volatilitaet bei hohen Handelsumsaetzen spricht historisch fuer eine baldige Wende an den Boersen. "Bald"
ist jedoch sehr relativ, der genaue Zeitpunkt kann auch mit der Volatilitaet nicht vorhergesagt werden. Die Volatilitaet hilft
lediglich, einen Rebound von der Trendwende zu unterscheiden. Zunaechst also muessen die Kurse steigen, dann koennen wir uns
an die Interpretation machen.
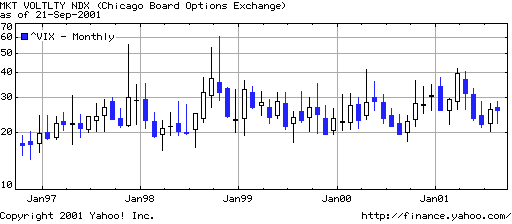
Dies ist die Ansicht eines privaten Analysten gewesen; interessant ist besonders ein
Blick auf den 4 Jahres - Chart des ^VIX!
Hier sollte man achten wann er nun wieder die Punktebereiche um 60 WIE IN 1998
erreicht!
ANALYSTENKOMMENTAR:
Patrick Fitzgerald, senior technical analyst at Thomson/IFR, said the
S&P could see 924.00, another low from October 1998, as soon as mid-October of this year.
Fitzgerald said a bullish
divergence is setting up on the weekly charts, but it is too early for it to send a clear signal.
He also noted that
the Chicago Board Options Exchange's Volatility Index (^VIX; s.o.), which rose to a 52-week high of 47.70 on Monday, would
likely need to approach October 1998 levels of near 60 to signal a bottom in U.S. equities. The VIX typically is a contrarian
indicator that moves in the opposite direction of the stock market.
Also, der ^VIX ist ein interessanter Indikator
- let's see!

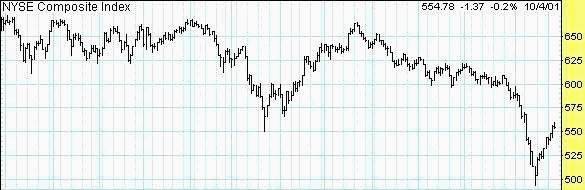
McClellan Oscillator McClellan
Oscillator Definition:
The McClellan Oscillator is a technical indicator based on the New York Stock Exchange,
not any one particular stock. It is a short term and intermediate term "market breadth" indicator, meaning it
is designed to determine the strength of a market trend. (Trendfolgeindikator) This is based on the concept
that a robust uptrend or downtrending market is characterized by a large number of stocks advancing or declining moderately,
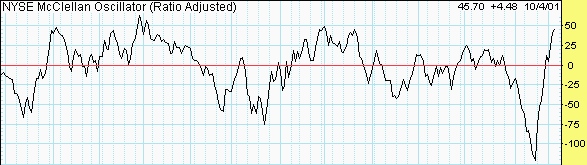
rather than a small number of stocks making large gains or losses. Interpretation:
There are two major sets of interpretations for the McClellan Oscillator. 1) The first interpretation is
to use regions to derive bullish and bearish signals. If the Oscillator extends below -100 or above 100, it represents
extreme oversold/overbought conditions, and suggests a continuation of the current downtrend or uptrend for a short-to-intermediate
period of time, respectively. If the McClellan Oscillator falls into
the -70 to -100 region and turns up, it can be considered bullish.
On the other hand, if it rises into the +70 to +100 region and turns down, it can be considered bearish. 2) The second interpretation
is to look at whether the Oscillator is positive or negative. - When the indicator goes from negative to positive, a bullish signal
is generated.
- When the indicator goes from positive to negative,
a bearish signal is generated.
----Okt-----Nov----Dez----Jan-----Feb-----Mar----Apr-----May-----Jun-----Jul----Aug---Sep--Okt----
Folgende Links bringen Euch zu besonders guten Erklaerungen zu diesem sehr bekannten "breadth indicator"
(inkl.
Praxisbeispiel am "Dow Industrials"):
www.investopedia.com
www.stockcharts.com
|